In 2017, the amount of exports of goods and services (current US$) worldwide reached 22.97 trillion US dollars.
The below article presents an analysis of how exports have increased since 1960.
The data is from World Bank.
Definition of Exports of goods and services (current US$) according to World Bank
“Exports of goods and services represent the value of all goods and other market services provided to the rest of the world. They include the value of merchandise, freight, insurance, transport, travel, royalties, license fees, and other services, such as communication, construction, financial, information, business, personal, and government services. They exclude compensation of employees and investment income (formerly called factor services) and transfer payments. Data are in current U.S. dollars”
World exports - Yearly trends - 1960 -2017
Exports of goods and services (current US$). World exports show a higher increase since 2000.
Note: Figure 1: Streamgraph - World Analysis. This Streamgraph is fully interactive: hover over the graph to see the tooltip. Last Updated Date: 02/10/2019
Trade Analysis by region - Exports of goods and services (current Million US$)
We can see a significant increase from 2000 to 2017 across all regions analysed.
For more information about region classication, please visit World Bank Country and Lending Groups.
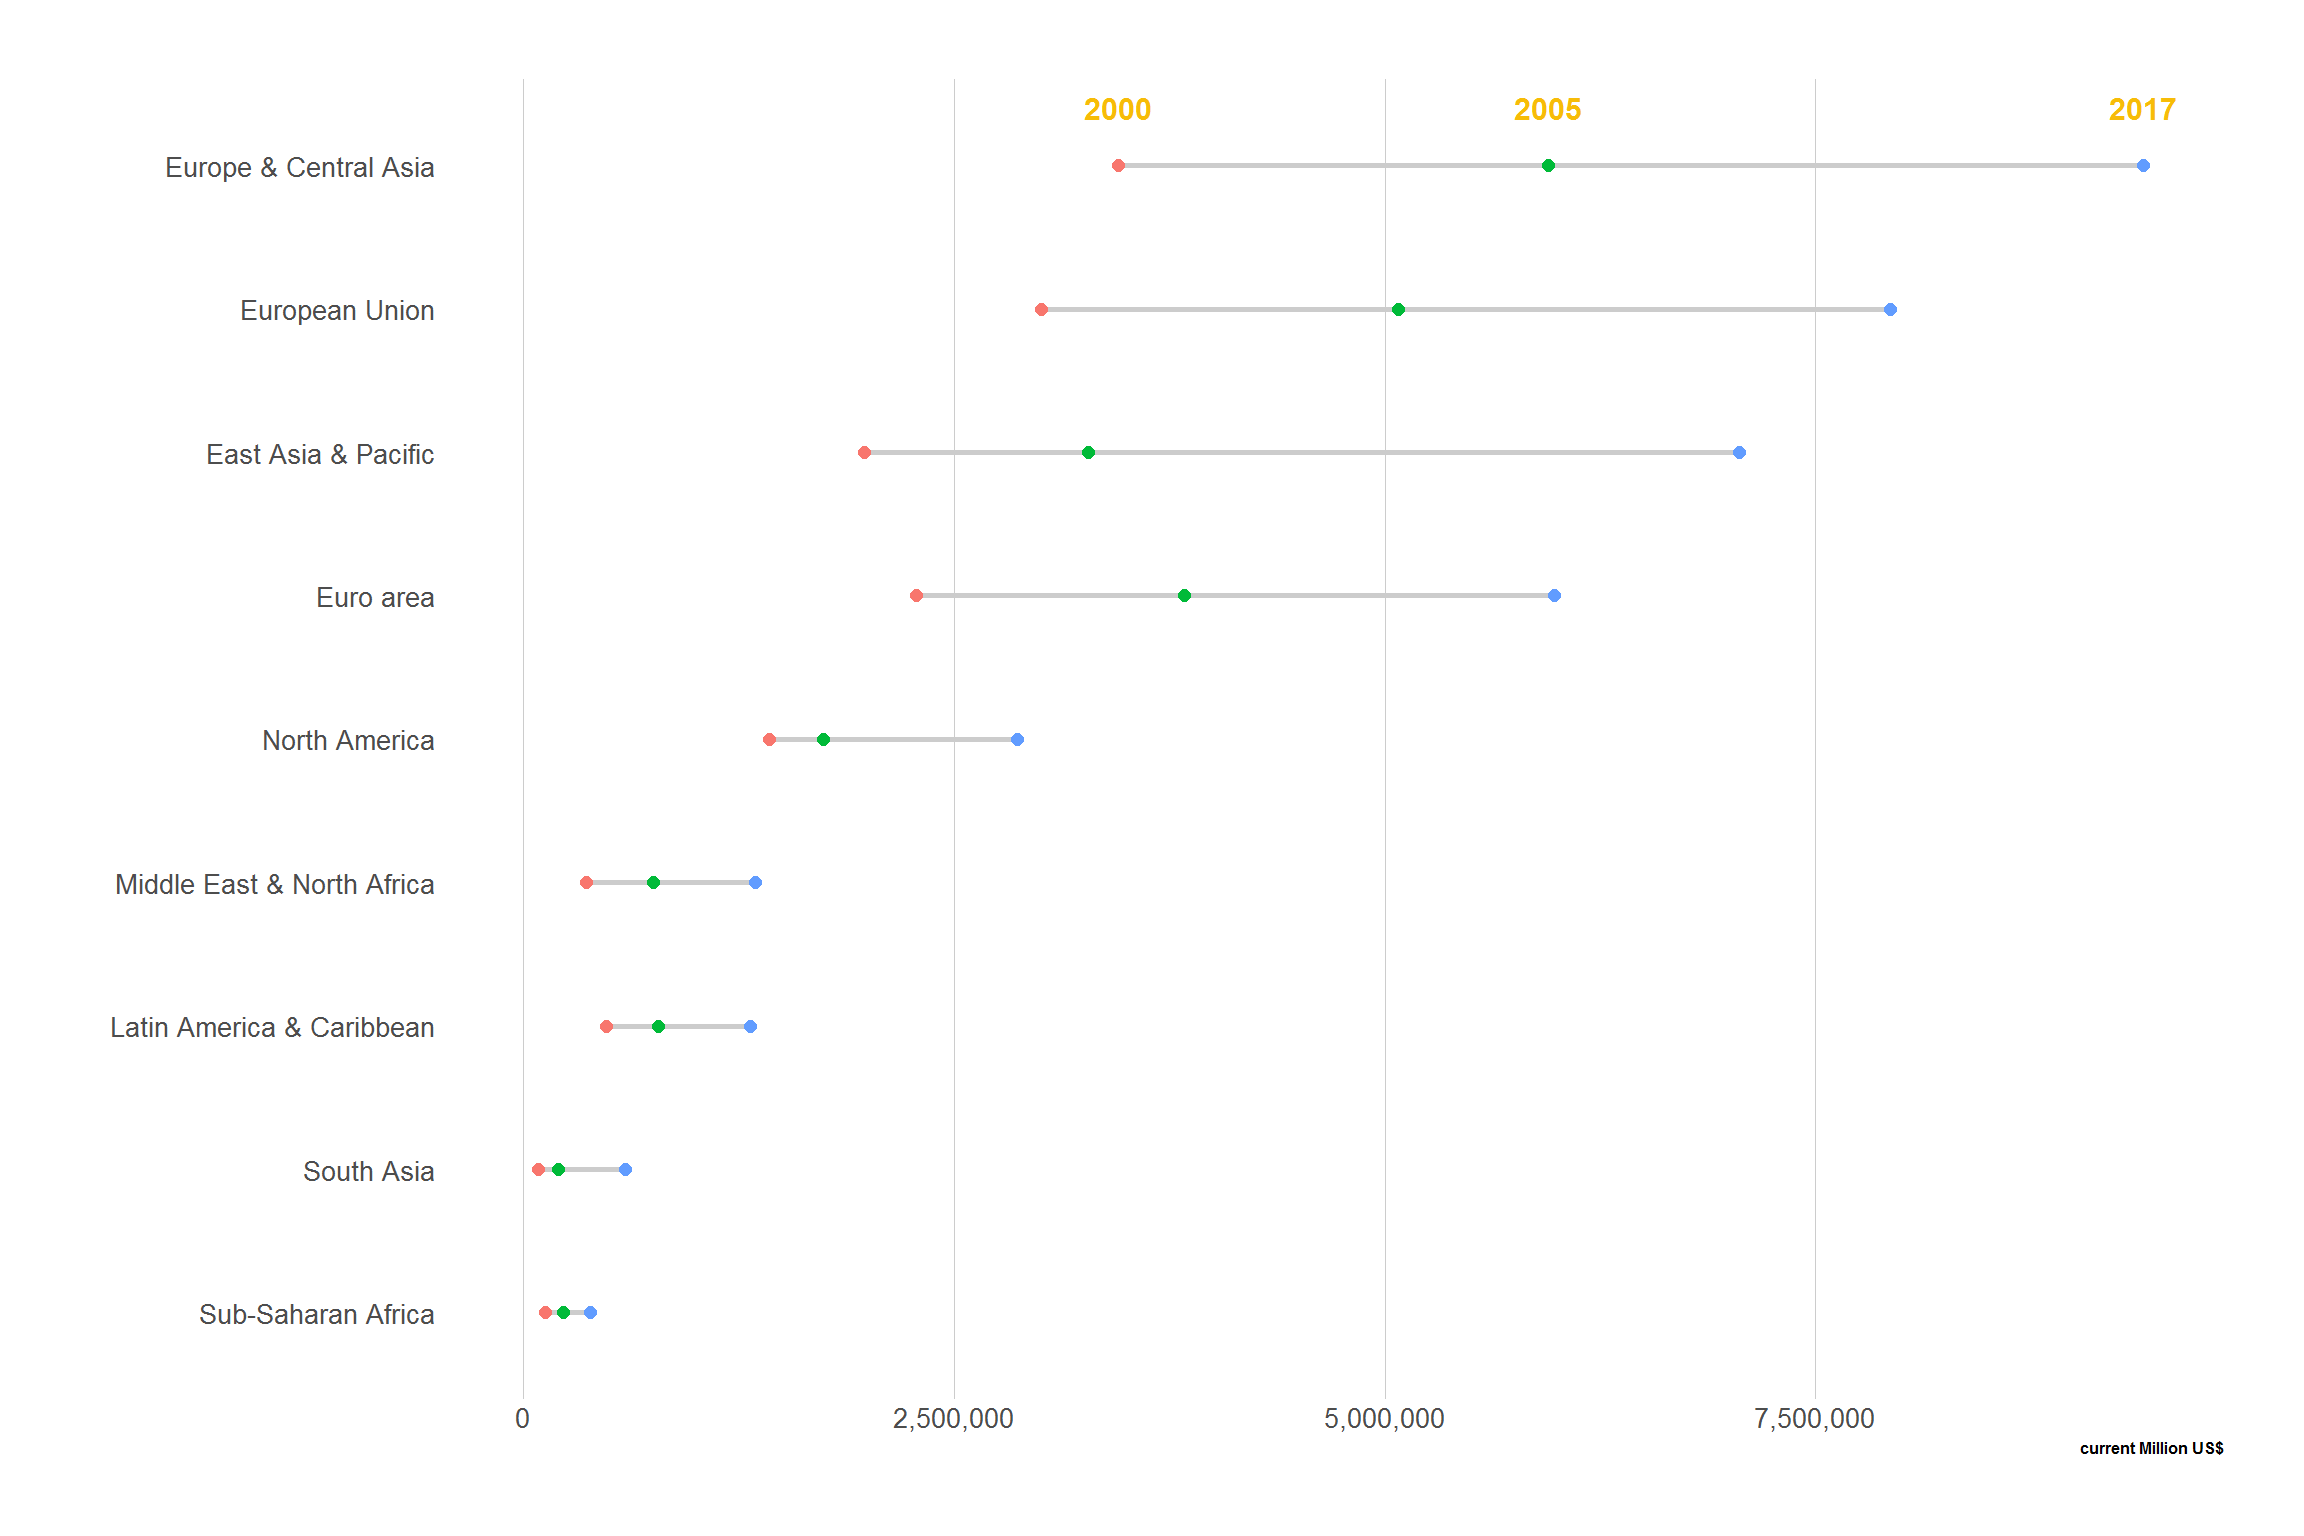
When we look at percentage change from 2000 to 2017 in the below table, all regions increased their amount of export of goods and services above 100%.
South Asia region was the fastest growing percentage-wise.
For more information about region classication, please visit World Bank Country and Lending Groups.
World Exports - Top 10 countries - Yearly trends - 1960 -2017
Top 10 countries by the highest “Exports of goods and services (current Million US$)” in 2017.
China led the world in exports with 2.42 trillion US dollars’ worth of goods and services in 2017 followed by the United States, and Germany.
- China - 2,424,199
- United States - 2,350,175
- Germany - 1,737,550
- Japan - 863,818
- France - 797,090
- United Kingdom - 794,770
- Netherlands - 693,661
- Korea, Rep.- 659,615
- Hong Kong SAR, China - 644,884
- Italy - 606,649
Note: Figure 2: Streamgraph - Top 10 countries. Fully interactive: hover over the graph to see the tooltip. Last Updated Date: 02/10/2019
Data source
Code, questions and feedback
Please visit: Github account
Please feel free to follow me on my Twitter account and ask any question or feedback you might have.
Thank you very much for your time in reading the article.