
On January 15th 2020, The US and China signed the US–China Phase One economic and trade deal at the White House.
The signed agreement published officially contains eight chapters on intellectual property, technology transfer, trade in food and agricultural products, financial services, macroeconomic policies and exchange rate, transparency, expanding trade, bilateral evaluation and dispute resolution.
The following article analyses how US and China trade in goods has evolved from 1985 to 2019.
Data source for the article: US Census Bureau
U.S. and China - Trade analysis from 1985 to 2019
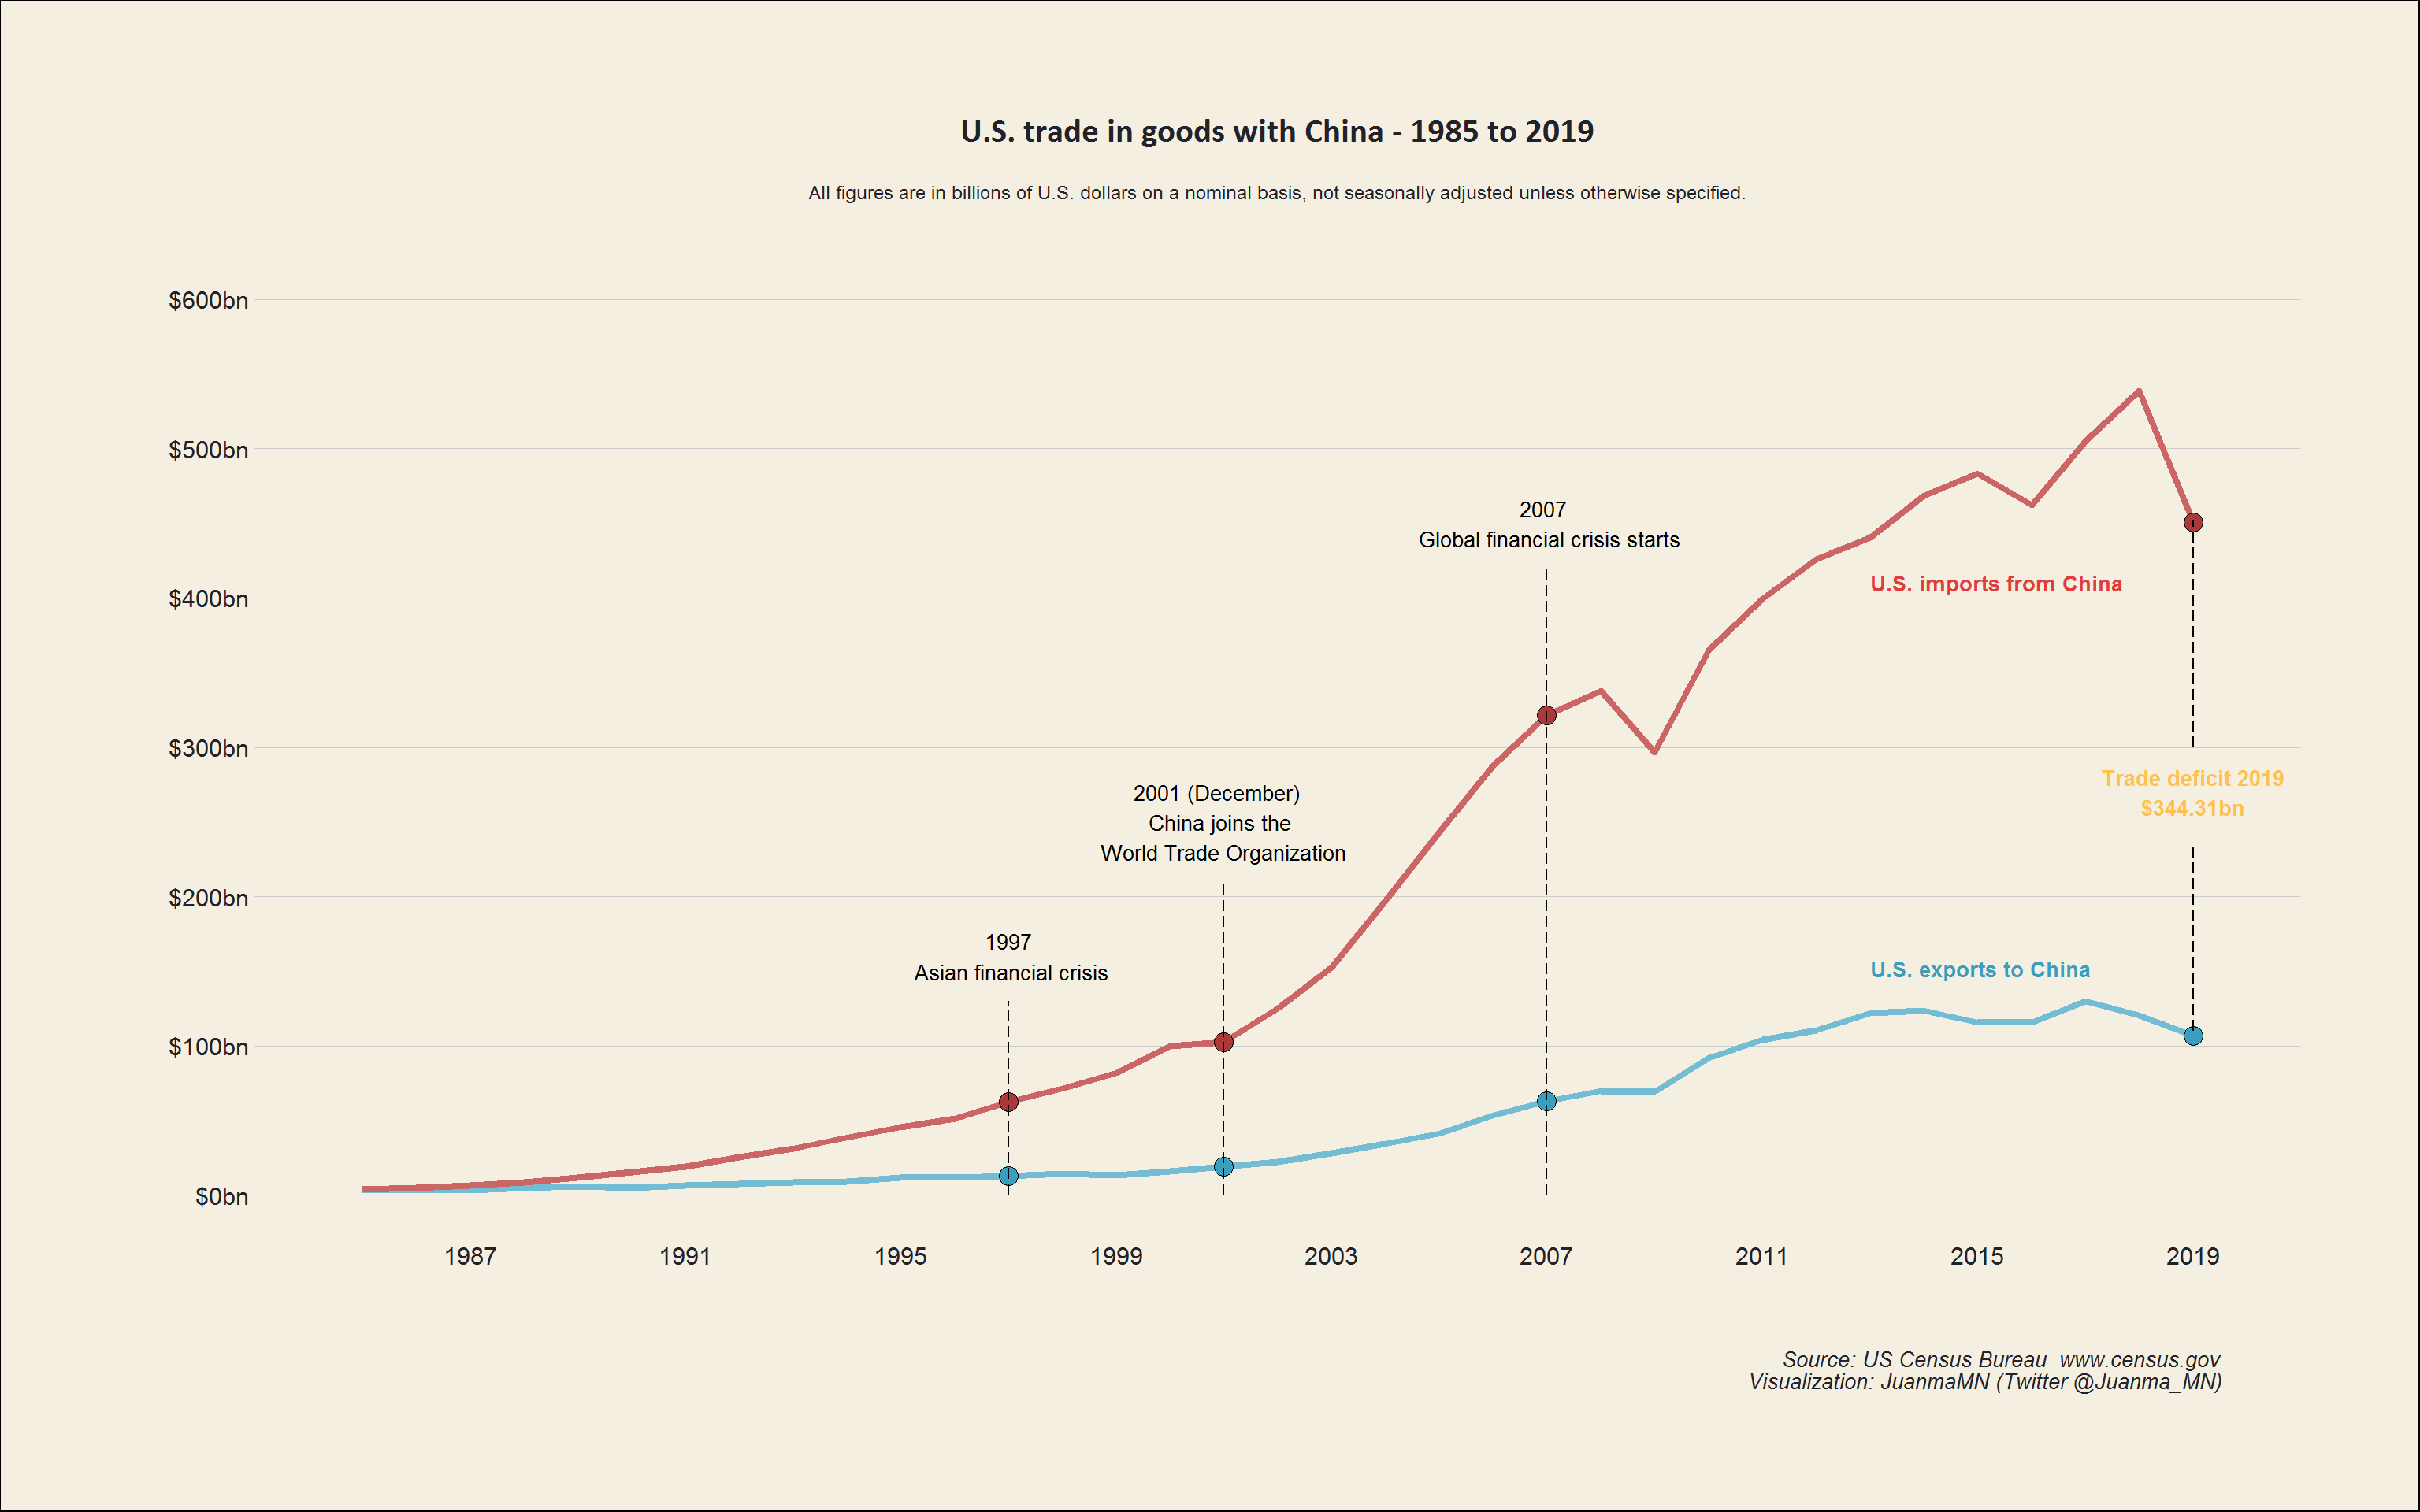
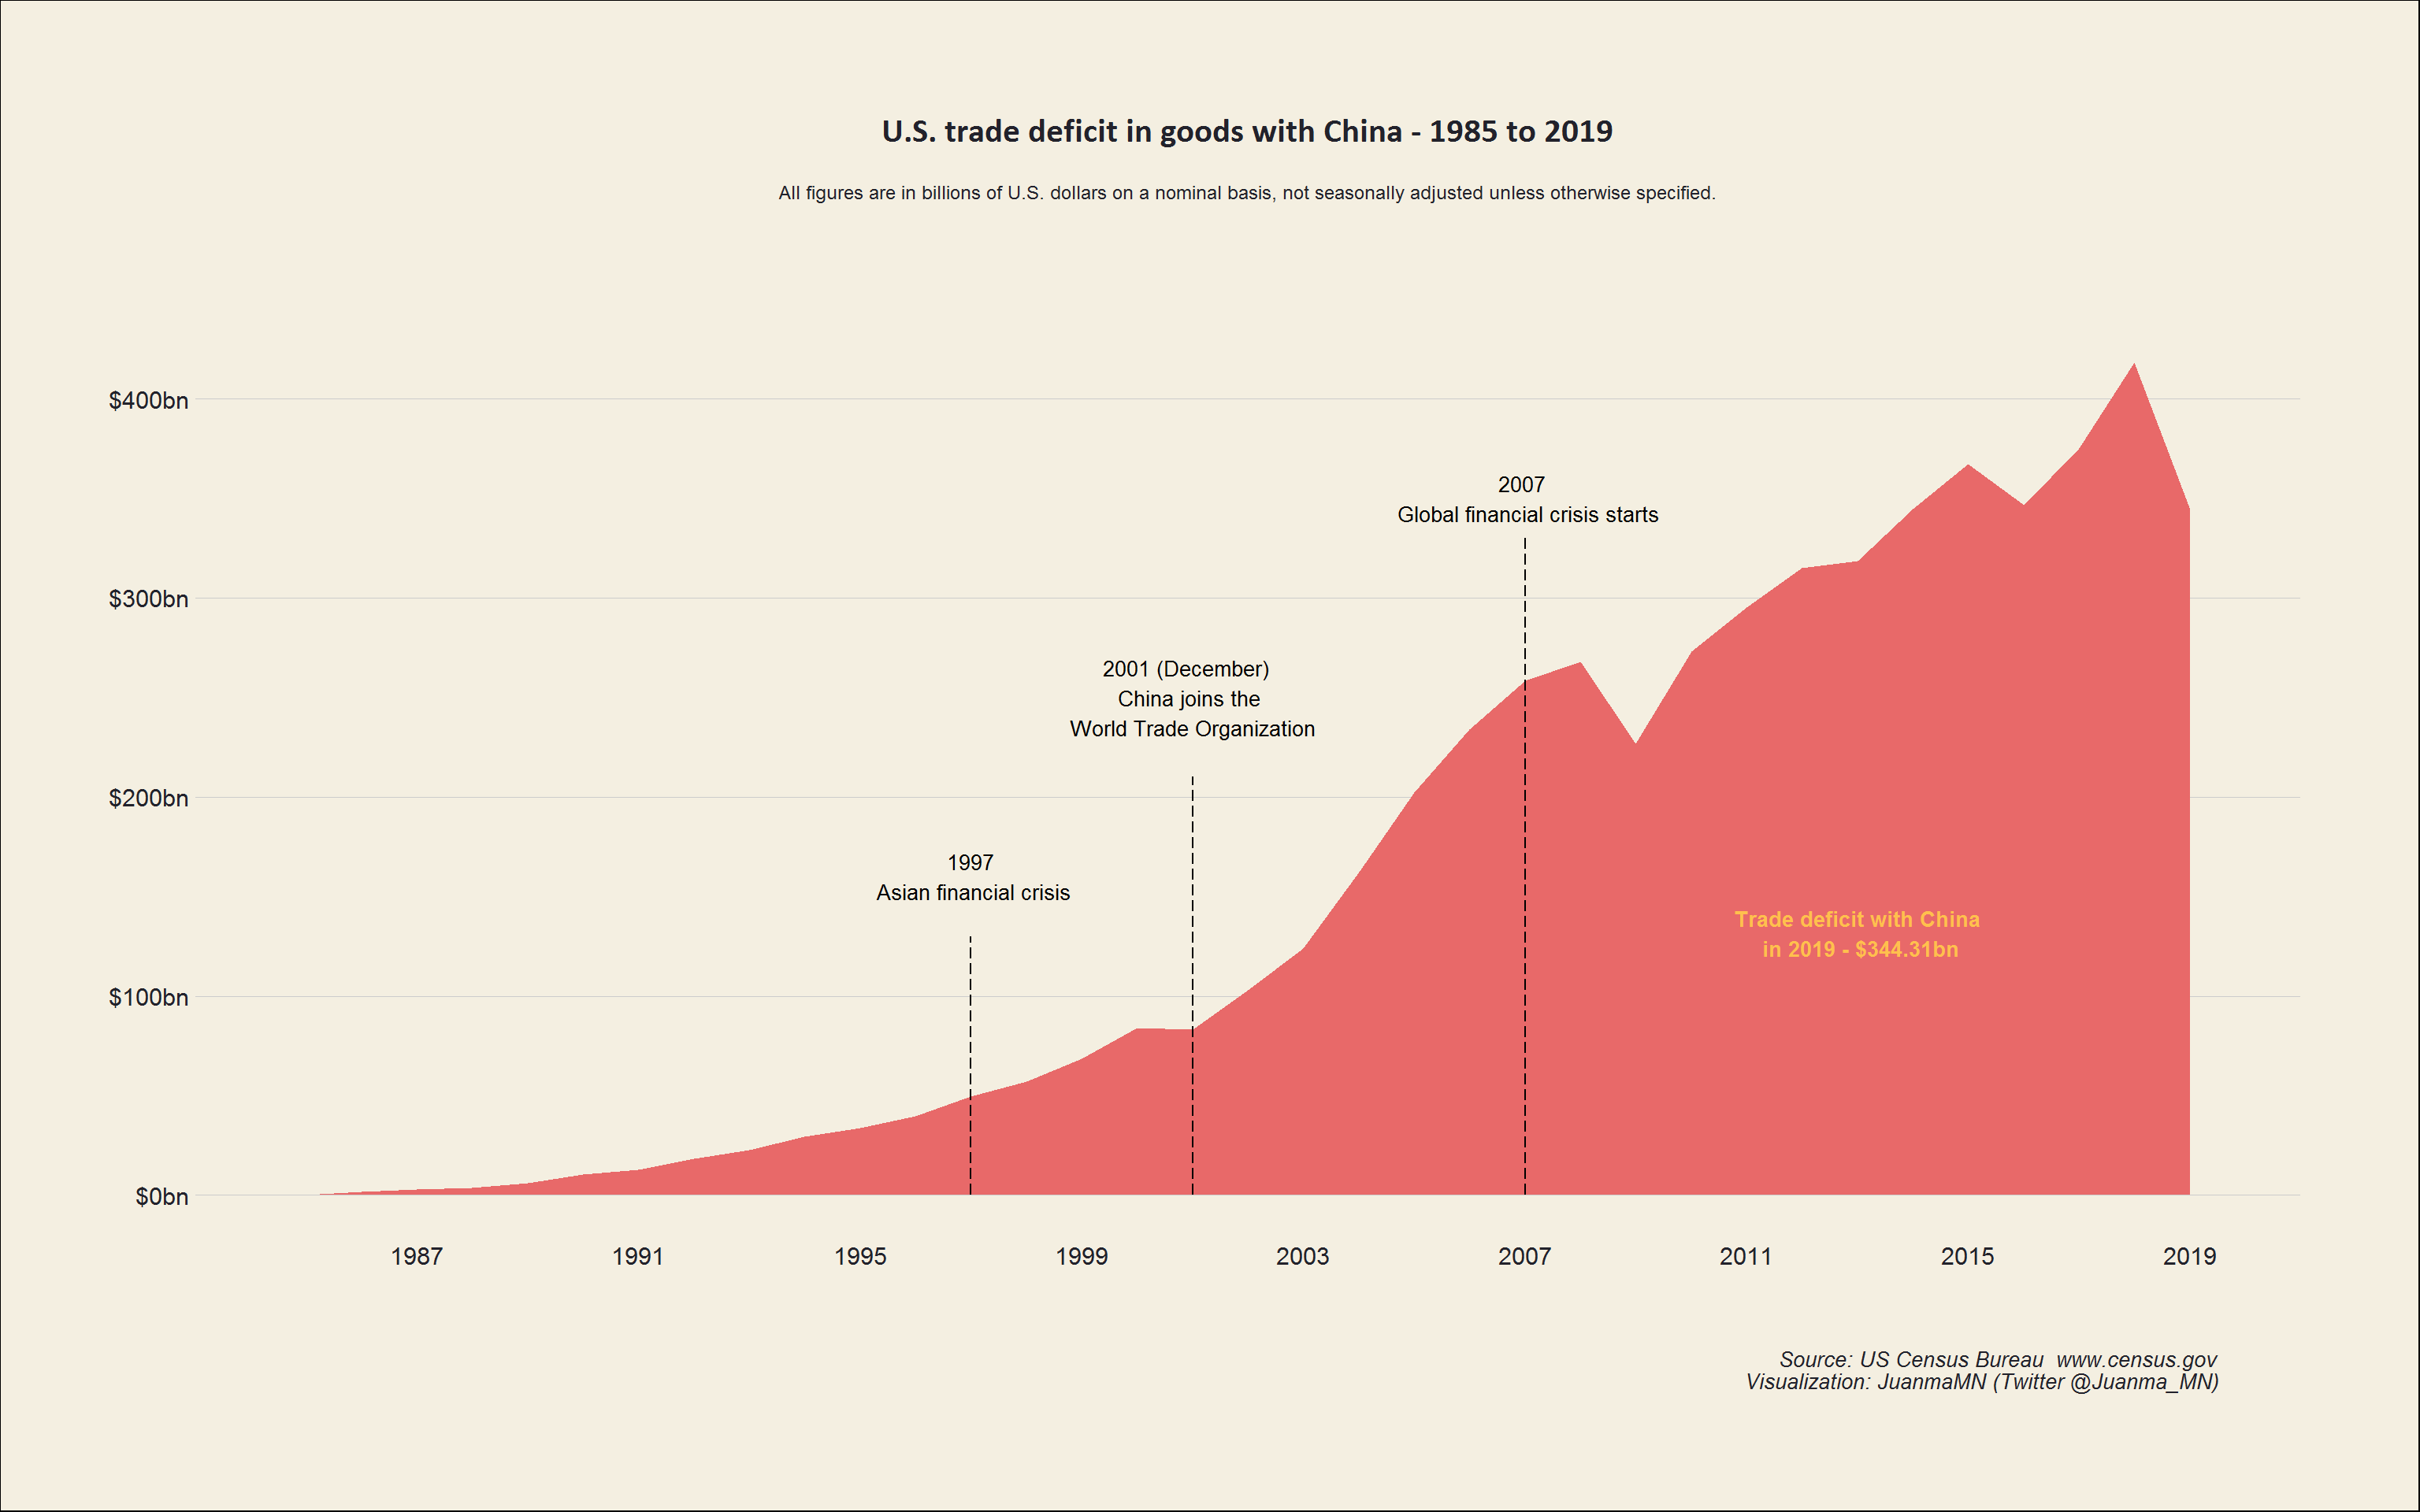
According to the US Census Bureau, in 2019, the US trade defict with China amounted to $344.31bn.
The US imports from China rose considerably from 2001, when China became a member of the World Trade Organization (WTO).
The below graph 1 shows how trade in goods between the US and China has changed since 1985 to December 2019.
U.S. and China - Trade analysis from 1985 to 2019
Code, questions and feedback
The code for this article is published in my github account.
Please feel free to follow me on my Twitter account and ask any question or feedback you might have.
Thank you very much for your time in reading the article.
1 Data source US Census Bureau